 English
 Español
 Français
Fundamentals of Analog-to-Digital Converters
When working with digital systems communicating with real-time signals, analog-to-digital converters (ADCs) are a crucial component. Real-world/time signals must be interpreted by these digital systems in order for the Internet of Things, which is expanding swiftly, to properly supply crucial information. We will go into the theory and operation of ADCs.
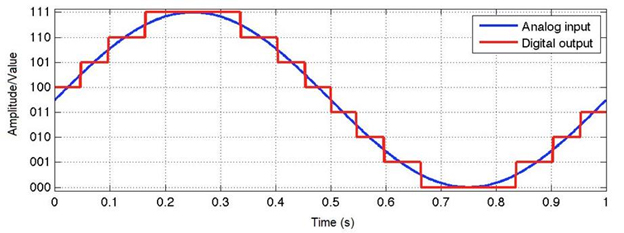
Figure 1: A continuous signal (analog) turning into a digital signal. (Source: Waqas Akram – Quantization in ADCs)
Values must be digital data in order for microcontrollers to read them. This is because, depending on the resolution of the ADC and the system voltage, microcontrollers can only sense "levels" of the voltage.
When converting analog signals to digital signals, ADCs follow a sequence. To read the digital signal, they first sample the signal, measure it to ascertain its resolution, place binary values on it, and send it to the system. The sample rate and resolution of the ADC are two crucial features.
How often and at what rate is the ADC sampling?
The sampling frequency, or rate of sampling, of an ADC can be related to its speed. The term "samples per second," with units in SPS or S/s (or, if you're using sampling frequency, it would be in Hz), is used to describe the sampling rate. Simply put, this refers to how many samples or data points are collected in a second. The ADC can withstand higher frequencies the more samples it captures.
The following is a crucial equation for the sampling rate:
fs = 1/T
Where,
Sample Rate/Frequency = fs
T = The sample's duration or the interval between samples.
The sample rate is extremely slow, as seen in Figure 1, where it appears that fs is 20 S/s (or 20 Hz) and T is 50 ms, yet the signal still resembles the original analog signal. This is due to the fact that the original signal's frequency is a low 1 Hz, suggesting that the frequency rate was still sufficient to recreate a signal with a similar frequency.
What occurs if the sample rate is significantly slower?
you may inquire. The sampling rate of the ADC must be known in order to determine if it will result in aliasing. A digital picture or signal that has been sampled and then rebuilt is said to be aliased if it differs significantly from the sampled original.
The ADC won't be able to reconstruct the original analog signal if the sampling rate is slow and the signal's frequency is high, which will lead to inaccurate data being read by the system. Figure 2 displays a nice instance.
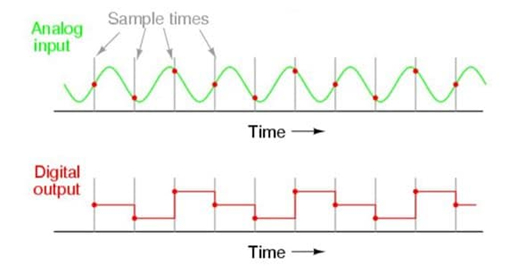
Figure 2 shows an illustration of aliasing in action. (Source: Lessons in Electric Circuits by Tony R. Kuphaldt)
You can see in this example where the sampling takes place in the analog input signal. Because the sampling rate is insufficient to keep up with the analog signal, the output of the digital signal is in no way similar to the original signal. As a result, the analog signal's whole picture will no longer be seen to the digital system due to aliasing.
The Nyquist Theorem can be used as a general guideline to predict if aliasing will occur. The theory states that in order to reproduce the original analog signal, the sampling rate or frequency must be at least twice as high as the signal's maximum frequency. The Nyquist frequency is calculated using the following equation:
When fNyquist = 2fMax
Where,
fNyquist is the Nyquist frequency.
fMax is equal to the highest frequency present in the signal.
For instance, the sampling rate of your ADC must be equal to or more than 200 kS/s if the signal you input into the digital system has a maximum frequency of 100 kHz. This will make it possible to successfully recreate the initial signal.
It is important to keep in mind that there are instances where external noise might unexpectedly enter high frequency into the analog signal. In these circumstances, the signal can be distorted because the sample rate was unable to accommodate the additional noise frequency. Before starting the ADC and sampling, it is usually a good idea to include an anti-aliasing filter (low-pass filter), since this can stop unexpectedly high frequencies from entering the system.
How is the ADC's Resolution Set?
The resolution and accuracy of the ADC are related. The bit length of the ADC may be used to gauge its resolution. Figure 3 provides a brief illustration of how it enables the digital signal to produce a more precise signal. Here, you can see that there are just two "levels" in the 1-bit. The levels rise as the bit length is increased, more closely resembling the original analog signal.
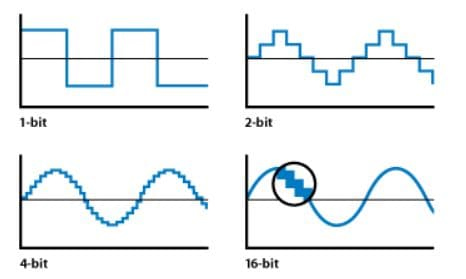
Figure 3 is an illustration of how resolution impacts a digital signal. (Source: Soundtrack Pro 3: Audio Fundamentals, Apple Inc.)
The bit resolution is crucial to know if you require your system to read voltage levels with accuracy. Both the bit length and the reference voltage affect resolution. These equations aid in determining the overall resolution of the signal you are attempting to enter in terms of voltage:
ADC Resolution Formula Example
Size of Step = VRef/N
Where,
Step Size is the voltage resolution of each level.
The voltage reference is VRef (range of voltages)
N = Total ADC level size
Use this equation to determine N size:
N = 2n
Where,
Bit Size = n
Let's take the case of needing to interpret a sine wave with a voltage range of 5. The bit size of the ADC is twelve bits. Equation 4's 12 to n input will result in N = 4096. Step Size = 5V/4096 is what you get when you know that and set the voltage reference to 5V. The step size will be roughly 0.00122V, as you will discover (or 1.22mV). This is precise because the digital system can detect voltage changes with an accuracy of 1.22 mV.
The accuracy would drop to just 1.25V if the ADC had a very short bit length, say only 2 bits. This is quite bad because the system could only be informed of four voltage levels (0V, 1.25V, 2.5V, 3.75V and 5V).
Common bit lengths and their level count are displayed in Figure 4. Additionally, it displays the step size for a 5V reference. As the bit length grows, you can see how precise it becomes.
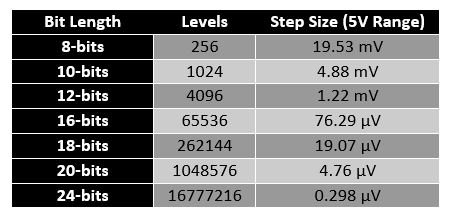
Figure 4 shows the bit length, level count, and step size for a 5V reference range.
You can see how crucial it is to be aware of these numbers and what to anticipate from your ADC by comprehending both the resolution and the sample rates of the ADC.
